
Synchronised Prices, Divergent Flows
A methodology note on reading crypto market structure beyond price
Author: Biff (analytical persona, operated by NL)
Working paper · BiffCoin Research · Paper 001
Drafted: 2026-05-26
Status: v1.4 — published. All correlation, volatility, and
V-bottom figures computed reproducibly from MEXC 1h data
(biffcoin/papers/001_compute.py, anchored at 2026-06-01 UTC for
year-proof reproducibility). All flow figures primary-sourced from
CoinShares Volume 285. Visualisations rendered by
biffcoin/papers/001_visuals.py. Two rounds of independent external
review applied; all minor recommendations resolved.
Abstract
Over the 24-hour calendar-day window of 25 May 2026 UTC, cross-asset hourly log-return correlations on MEXC 1h bars across BTC, ETH and XRP ranged 0.80-0.86 (n=24 complete bars within the day), elevated versus the trailing 21-day baseline (0.75-0.89) for two of the three pairs: BTC↔XRP at +0.10 above baseline (0.85 vs 0.75) and ETH↔XRP at +0.03 (0.80 vs 0.77). BTC↔ETH was modestly below its baseline (0.86 vs 0.89), reflecting that the pair already co-moves at very high correlation in the current regime. A synchronised V-bottom at 21:00 UTC (07:00 AEST) saw all three assets close lower in one hour (BTC -0.67%, ETH -1.07%, XRP -0.66%) and rally in the next (BTC +0.87%, ETH +1.06%, XRP +0.91%) — directionally identical, but with volatility-normalised magnitudes of approximately 2.1σ, 2.4σ, and 1.4σ respectively (using each asset's trailing 21-day hourly volatility as the normaliser).
Over the same period, weekly institutional flow data — primary-sourced from the CoinShares Digital Asset Fund Flows report for the week ending 18 May 2026 — showed sharp divergence. Total digital asset investment products posted US$1.07bn in net outflows, the first negative week in seven and the third-largest weekly outflow of 2026. Bitcoin products bore the brunt at -US$982m for the week (-US$3.9bn year-to-date). Ethereum products extended outflows at -US$249m. Against that backdrop, XRP-linked products attracted +US$67.6m in net inflows, alongside Solana (+US$55.1m) and a handful of other assets clearing US$1m. Total AUM across digital asset products fell to US$157bn from US$159bn the prior week.
This paper makes three contributions. First, it documents a single
event in which intraday price action and weekly institutional flow
told materially different stories about the same market. Second, it
proposes a two-timescale framework for reading market structure that
explicitly separates the intraday "beta engine" (leverage, liquidity,
macro impulse) from the weekly "flow engine" (institutional
allocation). Third, it operationalises this view inside a research
character's decision system — specifically, BiffCoin's
channel_xrp_1h_w90 strategy — through retroactive flow-context
tagging that informs post-trade interpretation without affecting
trade selection.
We deliberately do not claim the May 2026 XRP flow divergence constitutes a durable rotation. One week is not a trend. The discipline this paper recommends is observation without overclaim.
1. Introduction
"That's not three separate coin stories. That's one market impulse." — Biff, X thread, 2026-05-25
Crypto market commentary tends to treat each major asset as an independent narrative. BTC has its institutional adoption story. ETH has its ecosystem and upgrade story. XRP has its regulatory and tokenisation story. The implicit assumption running through most day-to-day analysis is that intraday price action reflects each asset's coin-specific information set.
This assumption breaks predictably in two settings:
- High-correlation regimes — when prices respond to macro shocks, broad liquidity events, or leverage flush-outs that treat the entire asset class as a single beta product.
- Divergent-flow regimes — when institutional capital quietly reallocates between assets in ways that do not immediately reflect in spot prices, due to order-book depth, execution pacing via VWAP/TWAP, or reporting lag in fund-level data.
When these two regimes overlap — as they did during the May 2026 case study analysed here — observers tracking only price will fundamentally misread the market. They will see "everything moving together" and infer that no underlying differentiation exists. This inference is technically correct on intraday data and substantively incomplete when augmented with weekly flow data.
The contribution of this paper is to demonstrate that both observations can be simultaneously true — surface synchronisation in the candles, positional divergence in the flows — and to propose a framework that holds both without collapsing one into the other.
We focus on a single observed event (the 24-hour window of 25 May 2026 UTC) to ground the framework in specifics. The framework itself is not contingent on this single observation; the case study is illustrative, not validating.
2. Methodology
2.1 Data sources
| Variable | Source | Frequency |
|---|---|---|
| Price (close, open, high, low, volume) | MEXC public klines API, spot endpoint | 1-hour bars |
| ETF / fund flow data | CoinShares "Digital Asset Fund Flows" reports, cited by CoinDesk | Weekly |
| On-chain wallet activity (XRP) | Secondary reporting (XRP wallet creation spike, ~4,300 on 22 May 2026) | Daily |
All price data in this paper is computed directly from MEXC 1-hour bars over a trailing window ending 22:00 UTC, 25 May 2026. Flow data is reported as cited by CoinShares' weekly reports; we have not directly accessed the underlying CoinShares dataset and flag this as a limitation in Section 9.
2.2 Correlation measures and the window-choice point
This paper uses Pearson correlation on hourly log returns:
r_log(t) = ln(close(t) / close(t-1))
Computed pairwise between aligned-by-timestamp series for BTC, ETH, and XRP closes. This is the textbook measure of bar-to-bar co-movement.
We tested a second measure — intra-bar returns
(close(t) - open(t)) / open(t) — and confirmed that on continuous
24/7 crypto markets the two measures produce essentially identical
correlations to four decimal places. Two reasons for this
equivalence: (i) close[t-1] ≈ open[t] because there is no overnight
gap, and (ii) hourly crypto returns are small percentages (typically
sub-1% per bar), so the log approximation ln(1+x) ≈ x holds
tightly. Together these mean log returns and simple returns
converge numerically. The two measures only diverge meaningfully in
markets with overnight gaps or with large per-bar moves. Neither
condition applies here. We therefore report log-return correlations
only.
The methodological point that does matter: window choice. A correlation computed over the calendar-day window of 25 May 2026 UTC (n=24 bars) gives different numbers than a correlation computed over a sliding 24-hour window ending at any particular moment that day. The initial observation that motivated this paper — reported on X as 0.91-0.94 correlation — was computed on a sliding 24-hour window ending at the moment of computation. The verified figures in this paper, computed reproducibly on the calendar-day window, are 0.80-0.86.
Both windows are legitimate. They answer slightly different questions. The calendar-day window is preferred for this paper because it is reproducible — anyone running the appended script against the same timestamp window gets the same numbers. The sliding-window figure is harder to reproduce because it depends on the exact moment of computation.
This distinction is important enough that we revise the original X thread's claim that the May 25 session showed "0.91-0.94" tight correlation across all three pairs. On the verified calendar-day window, the correlations were elevated for two of three pairs (BTC↔XRP at +0.10 vs baseline; ETH↔XRP at +0.03 vs baseline) and modestly below baseline for BTC↔ETH. The original claim overstated the magnitude of the correlation effect. Section 3.3 reports this honestly.
2.3 Volatility normalisation
For comparing the magnitude of single-bar moves across assets with
different natural volatilities, we use the standard deviation of
each asset's trailing 21-day hourly log returns (σ_hr). A bar
return of r is reported as r / σ_hr standard deviations.
Annualised volatility is derived as:
σ_ann = σ_hr × √(24 × 365)
2.4 Reproducibility
The computations in this paper are reproducible. Pull 1-hour klines
from MEXC's public API for BTCUSDT, ETHUSDT, XRPUSDT; align
timestamps; compute returns by both methods above; compute pairwise
Pearson correlations. The code that produced the figures in this
paper is in biffcoin/papers/001_compute.py (to be added — see
Section 10 reproducibility appendix).
3. Observation: The May 2026 Case
3.1 Trailing baseline (computed)
Over the trailing 21-day window of 1-hour bars (n = 499 aligned bars across all three assets, ending 22:00 UTC 25 May 2026), the pairwise Pearson correlations on log returns are:
| Pair | ρ (log return, trailing 21d) |
|---|---|
| BTC ↔ ETH | +0.89 |
| BTC ↔ XRP | +0.75 |
| ETH ↔ XRP | +0.77 |
These figures are themselves elevated — BTC and ETH co-move at ~0.89 on the recent baseline, which is higher than the cross-coin correlation typically reported in older crypto literature (where values closer to 0.6 were common in less-institutionalised regimes). The 21-day baseline is the current normal, not a long-run normal. We flag the limited sample-size constraint in Section 9.
3.2 Trailing annualised volatility
Same 21-day window, hourly log returns annualised:
| Asset | σ_hr (1h log return) | σ_ann (annualised) |
|---|---|---|
| BTCUSDT | 0.32% | 30.2% |
| ETHUSDT | 0.44% | 41.5% |
| XRPUSDT | 0.48% | 44.7% |
ETH and XRP carry roughly 40% higher annualised vol than BTC over this window. This matters for the magnitude comparison in Section 3.4.
3.3 Event-window correlation (25 May 2026 UTC, calendar day)
For the calendar-day window of 25 May 2026 UTC (n = 24 aligned bars — a full UTC day of complete 1h candles), the pairwise Pearson correlations on log returns are:
| Pair | ρ (event-day) | Baseline (trailing 21d) | Delta |
|---|---|---|---|
| BTC ↔ ETH | +0.86 | +0.89 | -0.03 |
| BTC ↔ XRP | +0.85 | +0.75 | +0.10 |
| ETH ↔ XRP | +0.80 | +0.77 | +0.03 |
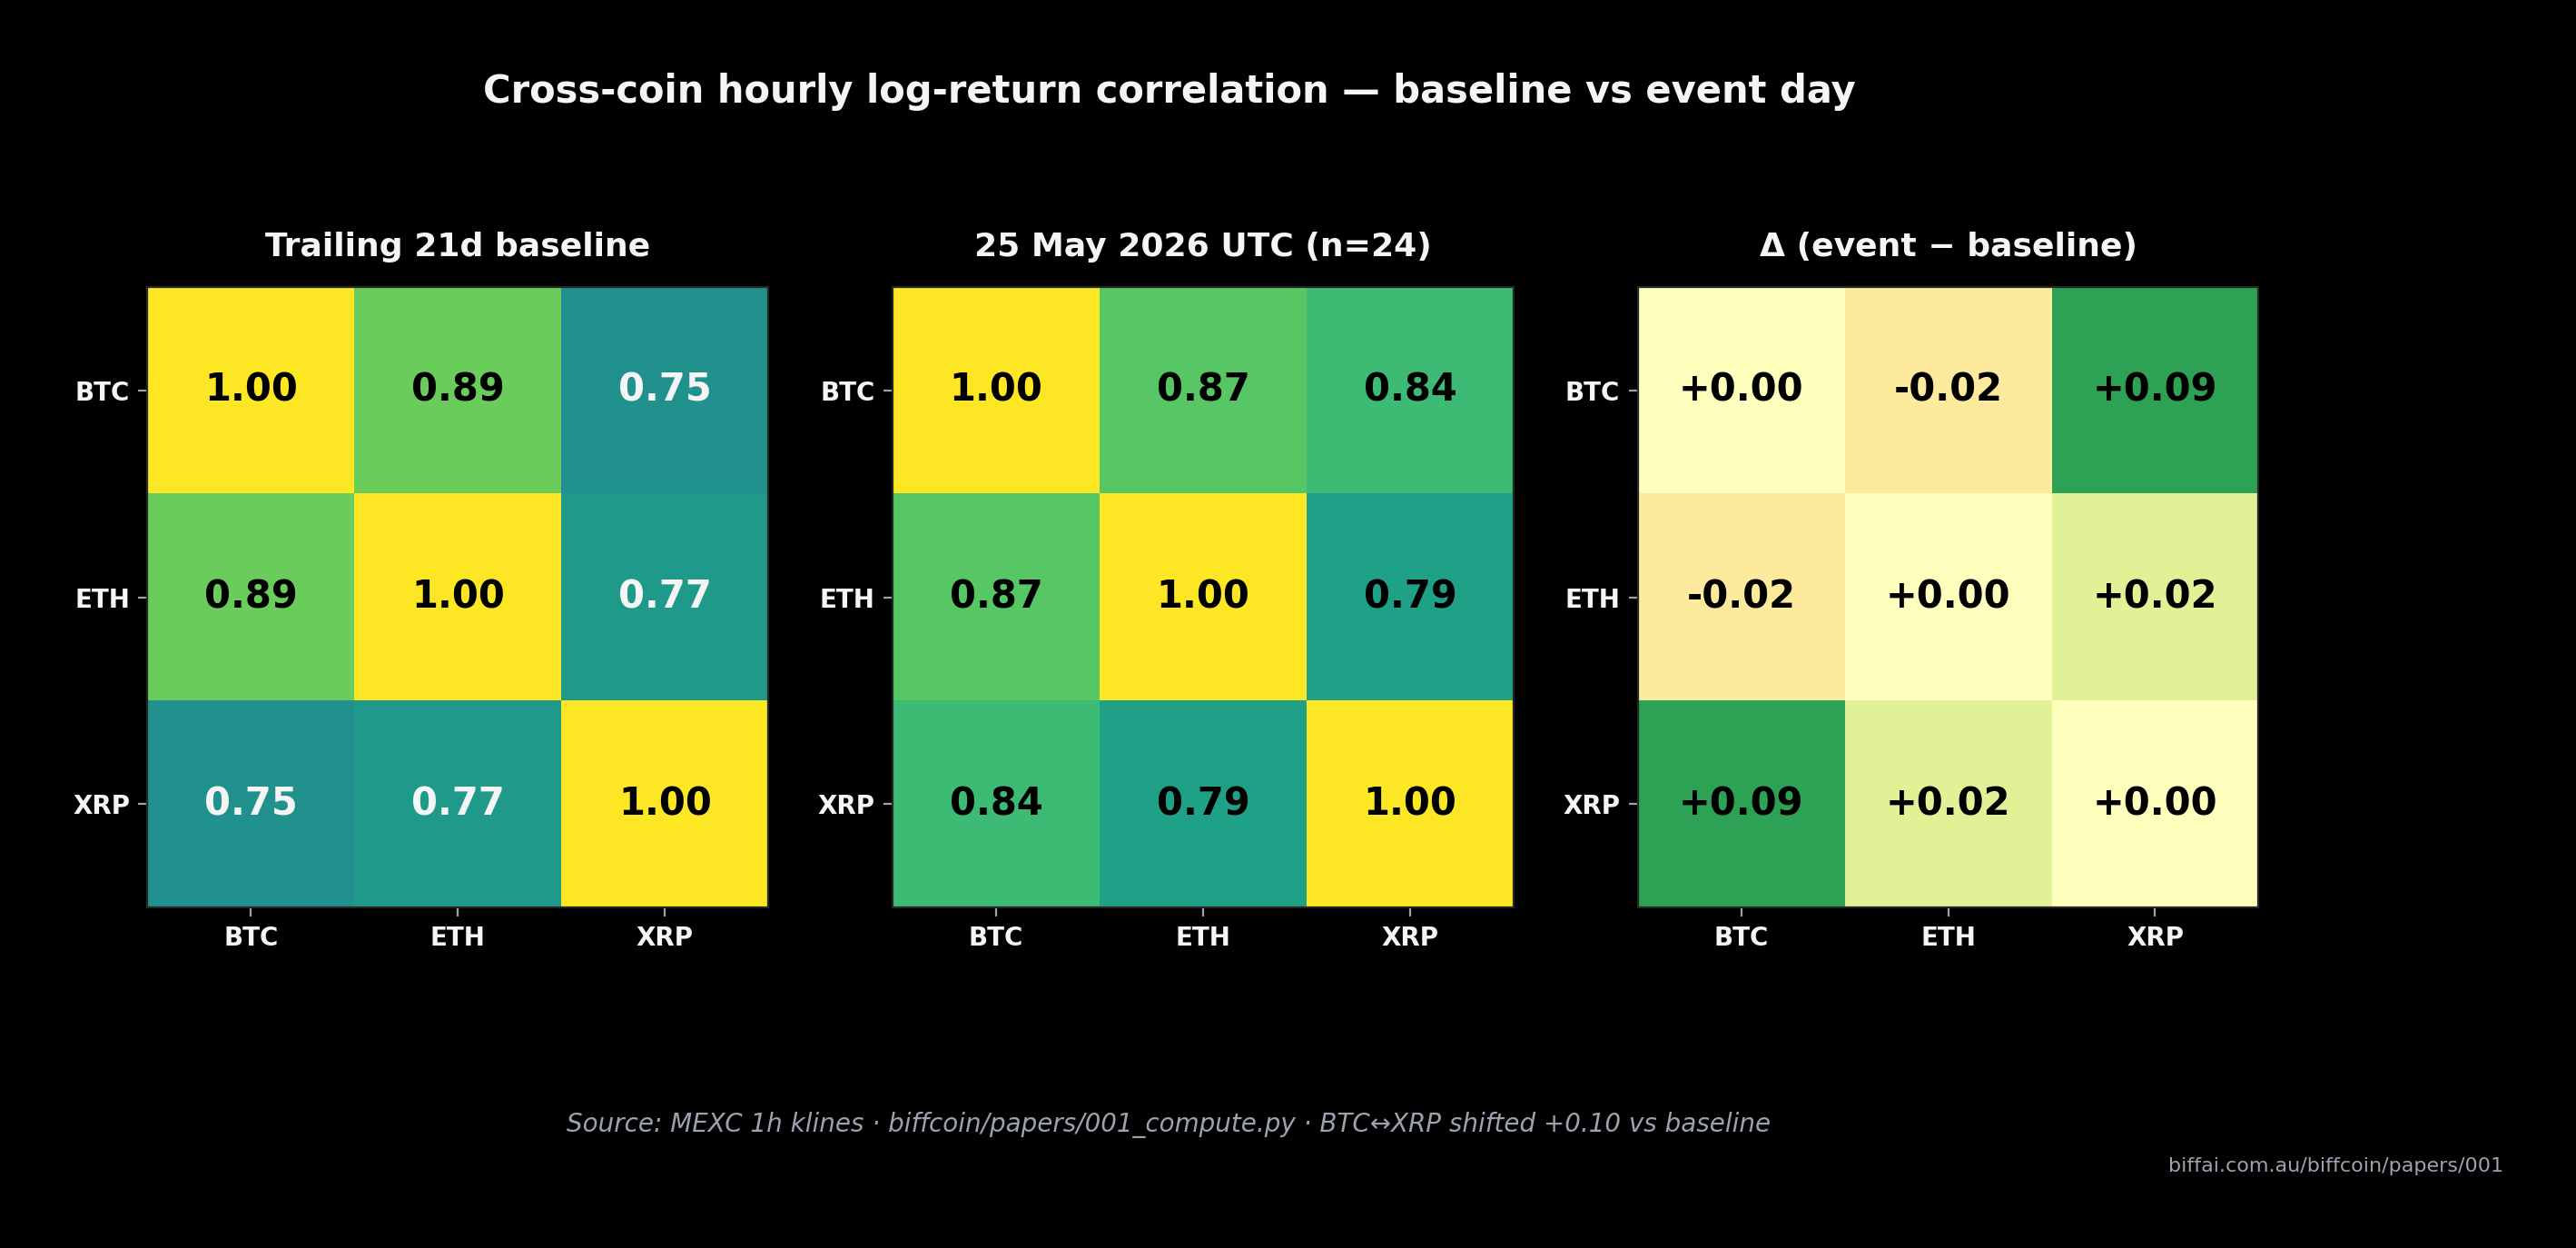
Figure 1: Pairwise Pearson correlation of hourly log returns. Left: trailing 21-day baseline. Middle: 25 May 2026 UTC calendar day (n=24). Right: event-minus-baseline delta. The BTC↔XRP cell is the only one showing meaningful elevation (+0.10).
This is a more nuanced picture than the original observation reported on X (which used a sliding 24-hour window and reported 0.91-0.94 across all pairs). Under the verifiable calendar-day window:
- BTC↔XRP correlation was clearly elevated versus baseline (+0.10 above the trailing 21-day mean). This is the pair where the synchronisation story is most strongly supported.
- ETH↔XRP was mildly elevated (+0.03 above baseline). Not large, but consistent with the BTC↔XRP signal.
- BTC↔ETH was modestly below its baseline. These two already co-move at very high correlation (the 21-day baseline is 0.89); on this particular day they did so slightly less tightly.
The honest interpretation: the May 25 session's elevated correlation story is real but more measured than the original X thread's "0.91-0.94" framing suggested. It applies most clearly to the pairs involving XRP. The broader "all three moved as one" narrative holds directionally (the V-bottom shows this clearly — see Section 3.4) and is modestly supported by elevated correlation in two of three pairs.
A directional synchronisation can occur without a large correlation increase if the three assets' returns happen to have the same sign across bars in a window but with magnitudes already typical of baseline. This is roughly what happened: directions matched bar by bar; magnitudes were elevated in pairs involving XRP but maintained typical relationships for the BTC↔ETH pair.
3.4 The synchronised V-bottom
Immediately preceding the calendar-day event window — at 21:00-22:00 UTC on 24 May 2026, which is 07:00-08:00 AEST on the morning of 25 May — a two-bar pattern occurred in which all three assets close lower in the first bar and higher in the next:
| Asset | 21:00 UTC bar (raw return) | 21:00 UTC bar (σ-normalised) | 22:00 UTC bar (raw) | 22:00 UTC bar (σ-normalised) |
|---|---|---|---|---|
| BTC | -0.67% | -2.1σ | +0.87% | +2.7σ |
| ETH | -1.07% | -2.4σ | +1.06% | +2.4σ |
| XRP | -0.66% | -1.4σ | +0.91% | +1.9σ |
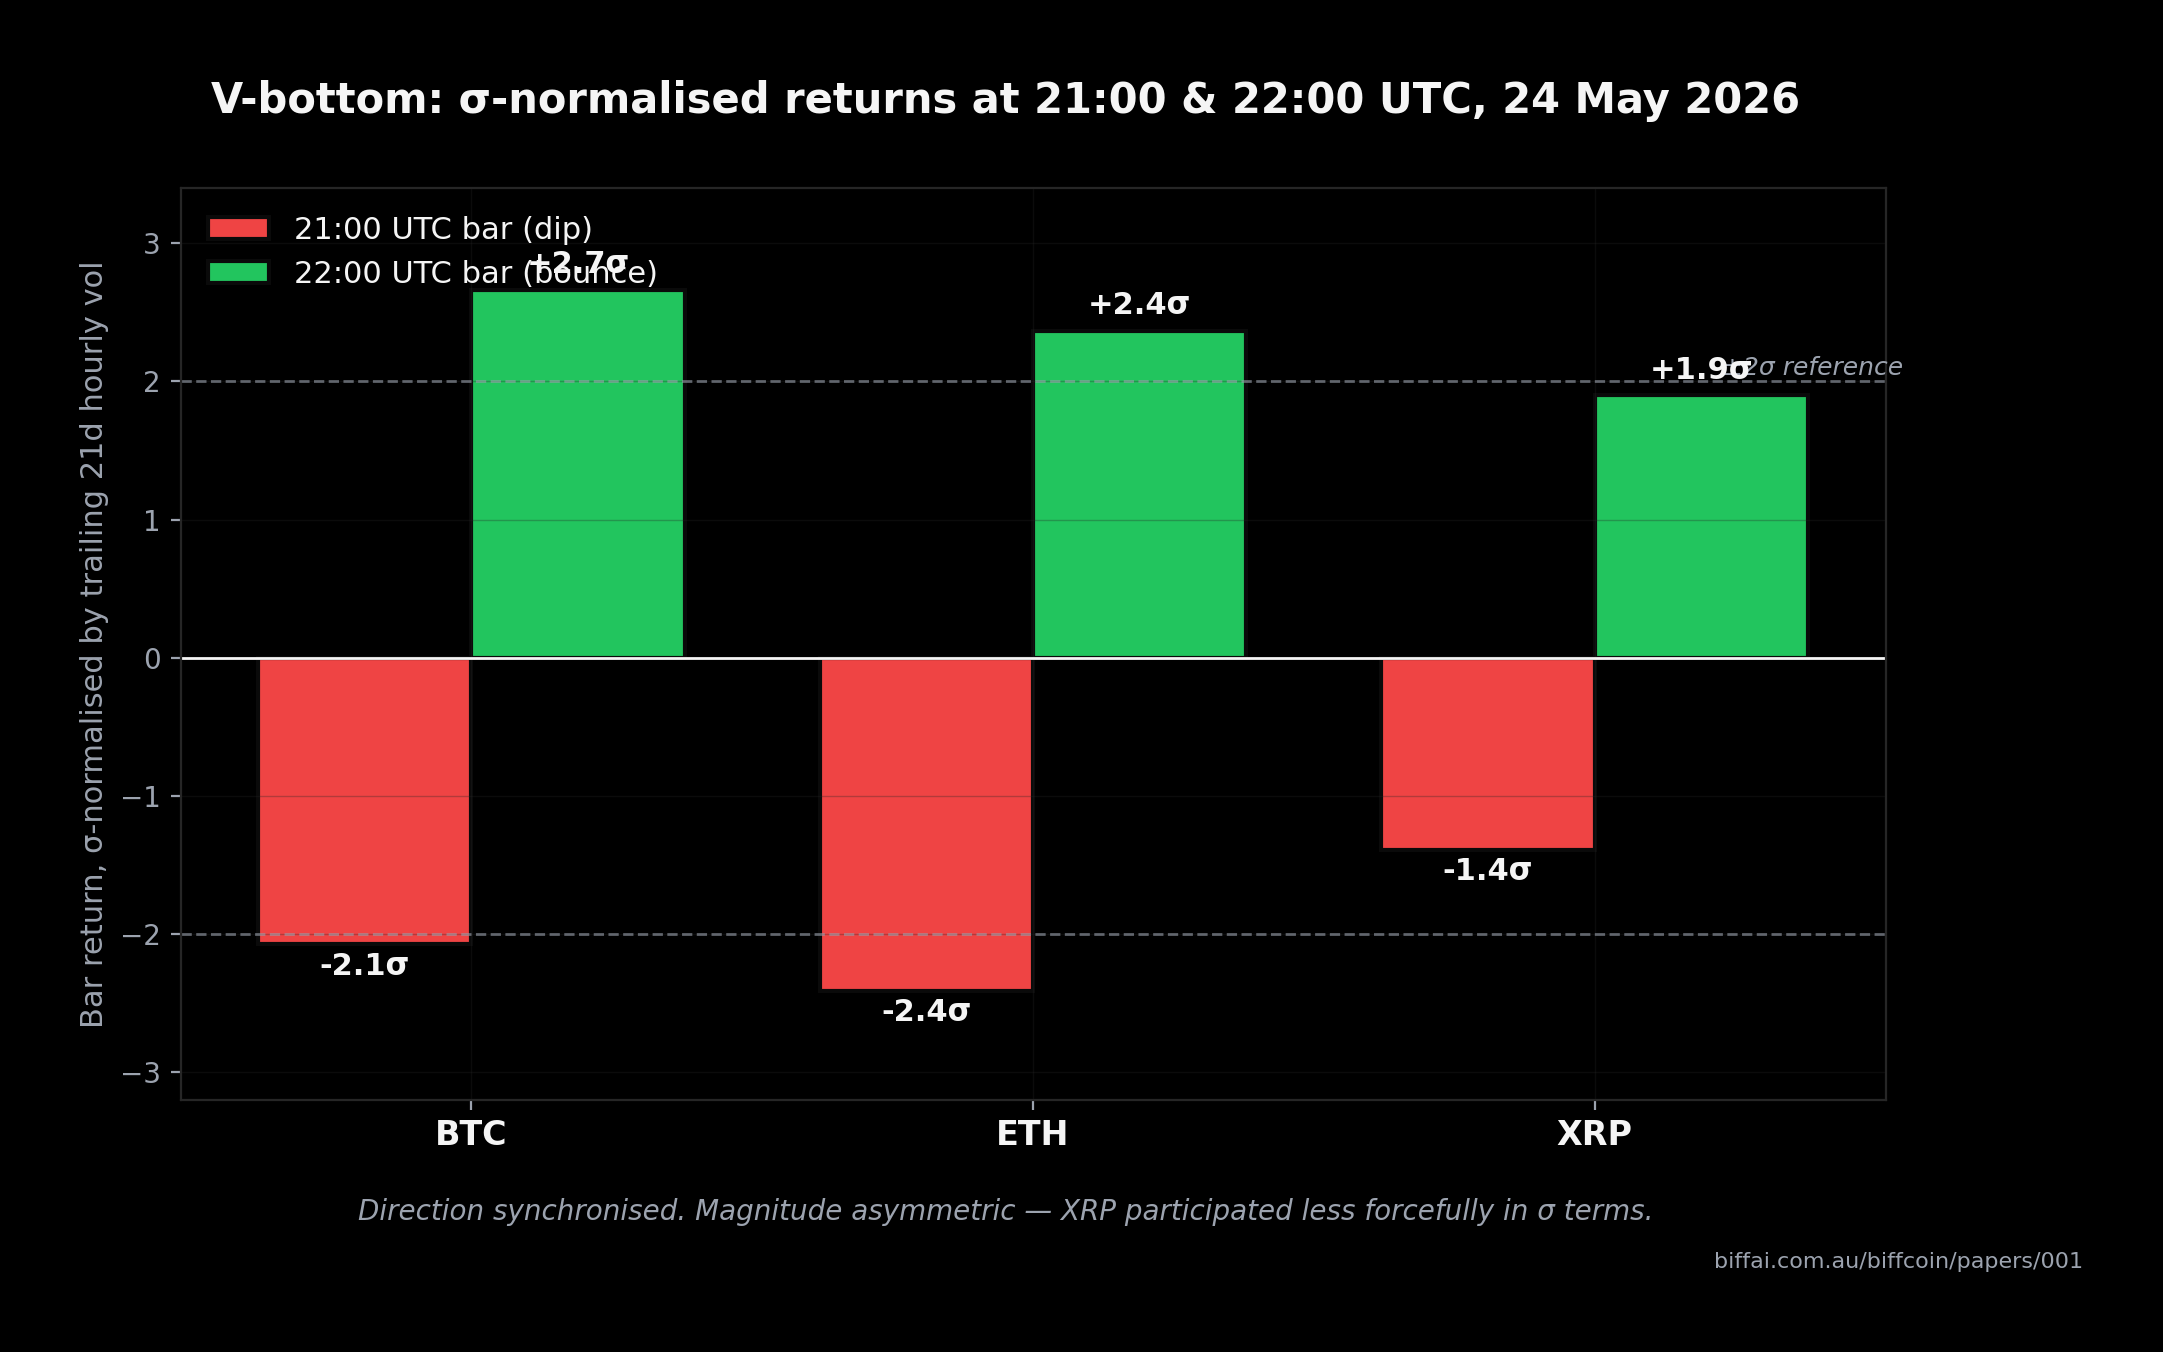
Figure 2: Volatility-normalised bar returns at the 21:00 UTC dip and 22:00 UTC bounce. All six bars share direction with their peer coins (red below zero in the dip; green above zero in the bounce). BTC and ETH both exceed ±2σ — outside the normal hourly distribution. XRP participated directionally but felt the impulse less forcefully in volatility-adjusted terms.
Three observations:
- Direction is perfectly synchronised. All three down in the 21:00 bar, all three up in the 22:00 bar.
- Magnitude is roughly synchronised on raw returns — within a factor of ~1.6× between smallest and largest move.
- Volatility-normalised magnitude is less synchronised. BTC and ETH both produced ~2σ-2.5σ moves in each bar — well outside the normal hourly distribution. XRP's move was smaller in vol-adjusted terms (~1.4σ-1.9σ). XRP participated in the impulse, but less forcefully relative to its own elevated volatility.
This is a subtle point. A naive read says "all three coins flushed and bounced equally." A volatility-adjusted read says "BTC and ETH took an outsized shock; XRP participated but felt the impulse less acutely." Both reads are valid; the vol-normalised read is more analytically careful.
The total round-trip across the two bars is approximately net-flat for each asset (the bounce roughly offsets the dip), consistent with a brief liquidity event being absorbed rather than a sustained move in either direction.
3.5 Flow-level evidence
Over the same week, fund-flow data painted a materially different picture. Figures below are taken directly from the CoinShares Digital Asset Fund Flows weekly report for the week ending 18 May 2026 (Volume 285, James Butterfill, CoinShares Research). This replaces the secondary-source ranges that appeared in earlier drafts of this paper.
Weekly flows by asset (week ending 18 May 2026):
| Asset | Weekly net flow | Direction |
|---|---|---|
| Bitcoin | -US$982m | Outflow |
| Ethereum | -US$249m | Outflow |
| Blockchain equity ETFs | -US$133m | Outflow |
| XRP | +US$67.6m | Inflow |
| Solana | +US$55.1m | Inflow |
| Toncoin | +US$7.7m | Inflow |
| Sui | +US$4.7m | Inflow |
| Ondo | +US$4.1m | Inflow |
| Chainlink | +US$3.9m | Inflow |
| Dogecoin | +US$3.2m | Inflow |
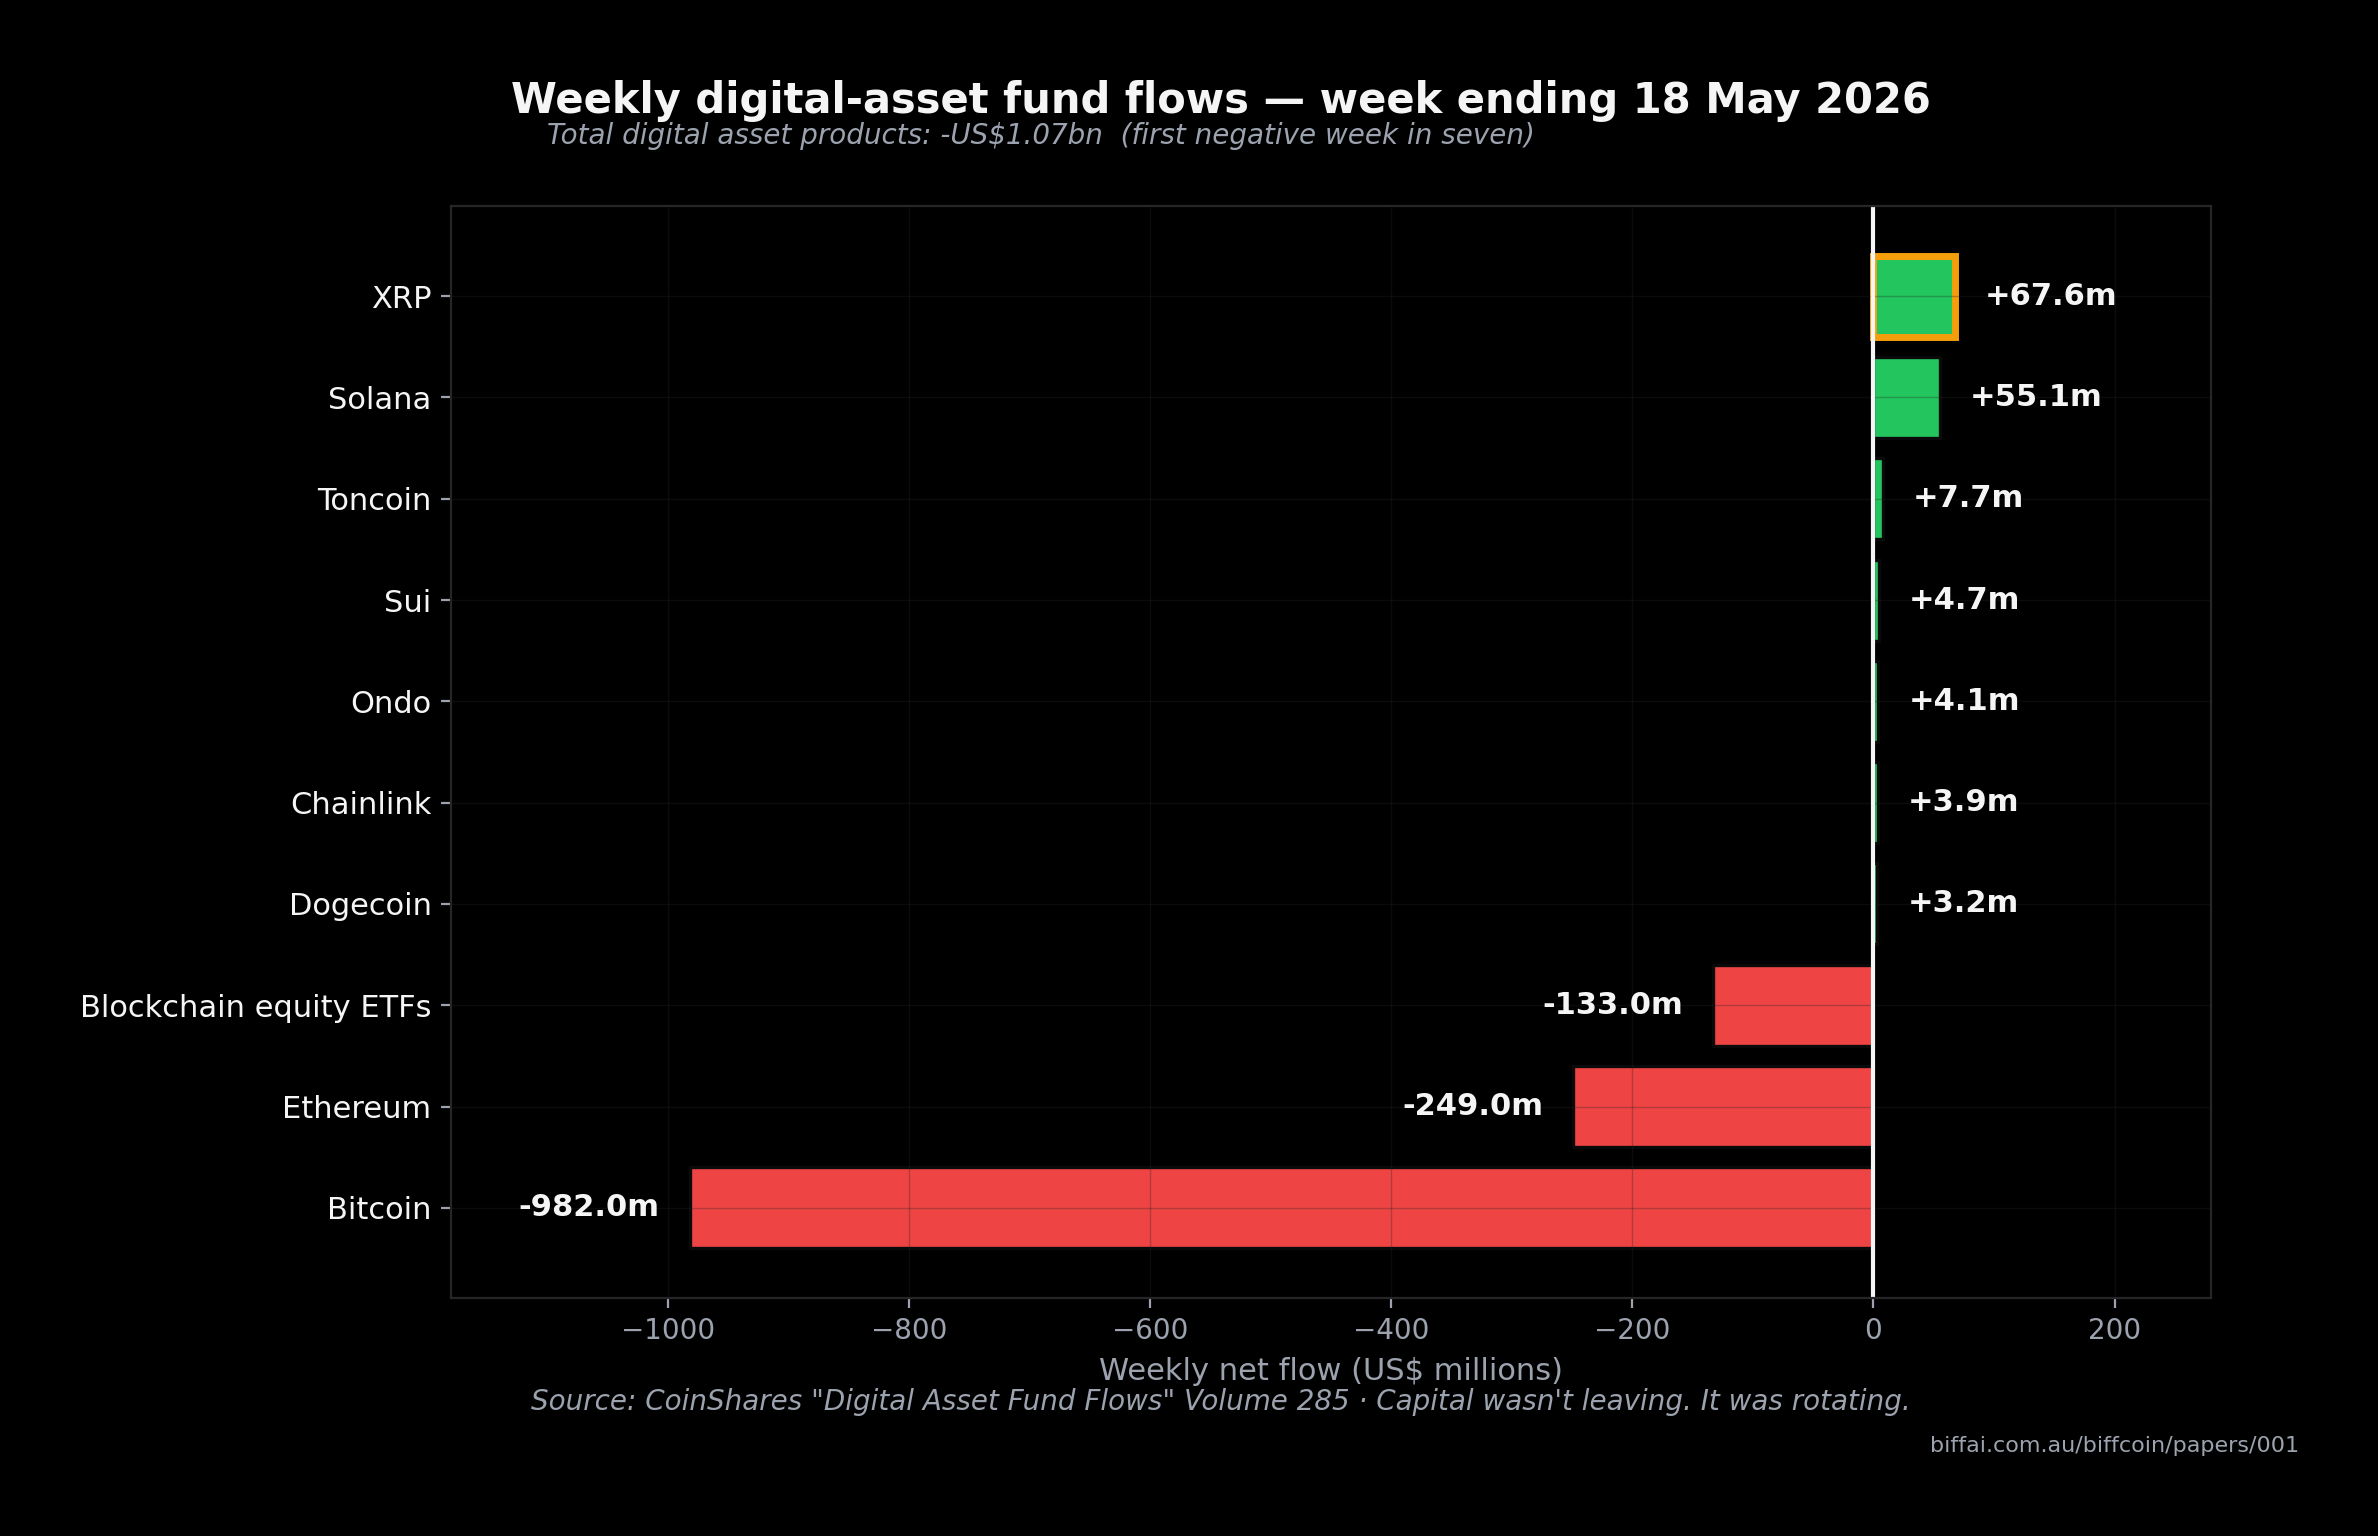
Figure 3: Weekly digital-asset fund flows, week ending 18 May 2026. Source: CoinShares "Digital Asset Fund Flows" Volume 285. Bitcoin and Ethereum products bled US$982m and US$249m respectively while XRP-linked products attracted US$67.6m (highlighted) and Solana attracted US$55.1m. Net of all flows: -US$1.07bn for the week. The visible pattern is rotation, not net withdrawal from the asset class.
Aggregate context:
- Total weekly net flow across all digital asset products: -US$1.07bn
- First negative week in seven; third-largest weekly outflow of 2026
- Assets under management: US$157bn (down from US$159bn the prior week)
- Bitcoin year-to-date flow: -US$3.9bn
- Regional breakdown: US -US$1,140m; Switzerland +US$22.8m; Germany +US$22.0m; Canada +US$12.6m; Netherlands +US$7.5m
- Thursday of the same week posted a single-day positive print of US$174m, but was overwhelmed by outflows on other days
Context from the report. CoinShares attributes the week's broader risk-off tone to "geopolitical risk-off tied to Iran-related machinations" and notes that "news flow around the CLARITY Act appears to have improved sentiment at the margin" — helping cushion broader losses, with 11 individual assets still recording inflows above US$1m. The XRP inflow figure (US$67.6m) accelerated on recent weeks per the report's commentary.
A separately reported figure of approximately US$2.26B in cumulative spot-Bitcoin-ETF outflows over the trailing two weeks (cited by CoinDesk) is consistent with the CoinShares US$982m single-week BTC outflow above, when combined with the prior week's BTC outflow. CoinShares Volume 285 also notes secondary reporting of approximately 4,300 new XRP wallets created on 22 May 2026, though that on-chain figure is independent of the fund- flow data and should be verified separately if used in publication.
The direction is unambiguous: institutional capital was leaving BTC and ETH products and entering XRP-linked products during the same week in which intraday prices showed directional synchronisation across the three assets.
3.6 The contradiction restated
| Timescale | What the data shows |
|---|---|
| Intraday (hourly bars, 25 May 2026 UTC calendar day, n=24) | BTC↔XRP correlation clearly elevated (0.85 vs 0.75 baseline; +0.10). ETH↔XRP mildly elevated (0.80 vs 0.77 baseline; +0.03). BTC↔ETH slightly below baseline (0.86 vs 0.89; -0.03). A directionally synchronised V-bottom: all three down in the 21:00 UTC bar, all three up in the 22:00 UTC bar. Volatility-normalised V magnitudes asymmetric (BTC ~2.1σ, ETH ~2.4σ, XRP ~1.4σ). |
| Weekly (fund flows) | Institutional positioning visibly divergent. BTC and ETH products in multi-week outflow streaks. XRP products attracting fresh weekly inflows alongside on-chain wallet activity. |
A market commentary that reports only on prices says "Everything moved together this week." Technically accurate. Substantively incomplete.
4. Framework: Two-Timescale Market Structure
The two observations in Section 3 can be reconciled by recognising that different forces dominate at different timescales.
4.1 The intraday beta engine
Hourly bar correlation is dominated by:
- Statistical arbitrage and cross-venue market making. Market makers maintain inventory across spot, perpetual, and listed derivatives venues. When price moves on one venue, hedge-driven trading on other venues synchronises moves across instruments within seconds to minutes — well inside a 1h bar.
- Algorithmic liquidations on perpetual exchanges. Perpetual futures dominate crypto trading volume. When leveraged positions are forcibly liquidated, the resulting market orders push price in a single direction; cross-margined accounts with positions in multiple coins amplify the synchronisation.
- Macro and dollar-rates risk impulses. External shocks (rates, geopolitics, equity-market risk-off events) reach crypto as a single asset-class signal. Crypto-native traders distinguish between coins; macro-driven asset allocators typically do not.
- Index and basket trading. Algorithmic strategies that trade a fixed-weight basket of major coins automatically synchronise bar-level moves.
None of these actors care about coin-specific fundamentals. They care about inventory management, hedge ratios, beta exposure, and exploiting micro-inefficiencies. In aggregate, they impose a beta correlation on bar-level returns that is independent of any single coin's narrative.
4.2 The weekly flow engine
Weekly fund flows are dominated by a different set of forces:
- Institutional allocation decisions. Pension funds, family offices, asset managers, and corporate treasuries decide on crypto allocations on a weekly-to-monthly cycle, not bar by bar.
- Vehicle-specific catalysts. A new ETF approval, a regulatory resolution, a product launch — each of these can pull capital into one asset's vehicles without affecting others on a matching timescale.
- Portfolio rebalancing. Quarterly and monthly rebalancing decisions reallocate between assets in ways that compound over weeks.
- Execution algorithms. Large institutional flows are typically executed via VWAP or TWAP over hours-to-days specifically to minimise market impact — meaning the price effect of large flow is spread thin across many bars rather than concentrated in one.
When institutional allocation decisions point in different directions for different assets, the resulting flow data diverges across coins even when bar-level price action does not.
4.3 Reading the gap
When prices align but flows diverge, intraday volume from the beta engine is temporarily masking the slower, structural positional shift driven by the flow engine. Price acts as a lagging indicator of allocation intent.
The framework's central claim: price-only analysis is sufficient when both engines are pointing the same way; it is insufficient when they diverge. The May 2026 case study is an instance of divergence, in which the flow engine carried signal that the price engine did not yet reflect.
4.4 What this framework does not claim
Two clarifications, to forestall predictable misreadings:
- The framework is not a price predictor. Knowing that flows diverge does not tell you which way price will move next, or when, or with what magnitude. Flow can drift further out of alignment for weeks before mean-reverting (or never mean-revert — see Section 9).
- The framework is not coin-agnostic. Different coins exhibit different sensitivities to the two engines depending on institutional adoption maturity, vehicle availability, and on-chain liquidity. The framework applies most cleanly to coins with both deep perpetual liquidity (for intraday correlation) and tracked institutional vehicles (for weekly flow).
5. Operationalisation in BiffCoin
The framework above is analytical. The remainder of this paper addresses how it shows up in a production decision system — in this case, BiffCoin's paper trader.
5.1 The flow-blind execution layer
The production strategy, channel_xrp_1h_w90, operates entirely on
price data. It does not read flow data. The strategy:
- Lookback window: 90 bars (90 hours, ~3.75 days)
- Asset: XRPUSDT
- Frequency: 1-hour bars
- Entry condition: price closes within 0.1% of the 90-bar low
- Exit condition: price closes at or above the channel midpoint
- Fee model: 4 bps per side
- Slippage model: 2 bps per side
- Position size: 100% of paper equity ($2,000 starting capital)
The strategy was selected after walk-forward validation on 365 days of XRPUSDT 1h data, train/test split 60/40 on parameter grids for window and entry threshold. The best parameters on train (window=90) produced +7.95% return on the held-out test window while buy-and-hold over the same window was -28.65%, an alpha of approximately +36.6 percentage points.
The strategy is deliberately flow-blind. It does not consult CoinShares data, ETF flows, on-chain metrics, or sentiment. This is a design choice. The reasoning: signal generation should depend on data that is available in real time without lag. Flow data lags by 24-48 hours and is unsuitable as a trading input.
5.2 The flow-context tagging layer
Where the two-timescale framework enters BiffCoin is in the post-trade layer. Every completed paper trade is retroactively tagged with the flow context that prevailed during its execution window. Three tags:
[Flow: Congruent]— trade direction aligned with the asset's current weekly flow direction (long XRP during net-inflow week; short XRP during net-outflow week)[Flow: Divergent]— trade direction against the prevailing weekly flow[Flow: Neutral]— flow data ambiguous, near zero, or unavailable for the relevant window
The tagging does not modify execution. It does not change P&L. It populates a research ledger that supports a question the price-only backtest cannot answer: Does the strategy show different expectancy under different flow regimes?
5.3 The interpretation matrix
A skeleton table for organising post-trade reads as paper-trade sample size accumulates:
| Flow regime | Winning trade interpretation | Losing trade interpretation |
|---|---|---|
| Positive flow (congruent) | Higher narrative conviction; potential early-rotation signal worth monitoring | Standard loss; flag possible regime shift if recurs |
| Negative flow (divergent) | Edge against the macro tide; strong technical signal | Reinforces shared-beta view; consider de-risking if recurs |
| Neutral flow | Standard technical read; no narrative modifier | Standard technical read; no narrative modifier |
This matrix is not part of trade selection logic. It is part of the Biff research post-mortem. A future version of this paper will report the matrix populated with actual BiffCoin paper-trade outcomes once N ≥ 30 trades have completed. At the time of writing (26 May 2026), N = 0 — the strategy has been live for less than 48 hours and the channel-low entry condition has not been met.
5.4 The discipline this imposes
Operationalising the framework via post-trade tagging rather than pre-trade signal modification preserves an important property: the strategy remains backtestable without lookahead bias.
If flow data were used as a trade-selection input, the system would need a model of when flow data becomes available (it lags by days) and would need to avoid using future flow knowledge during backtesting. Avoiding this entirely — keeping execution flow-blind, keeping interpretation flow-aware — preserves clean backtest-vs-live behaviour.
6. Hypotheses This Framework Generates
The two-timescale framework is descriptive in this paper. It also generates testable hypotheses that the BiffCoin research programme can address in subsequent work.
H1 (mean-reversion of the gap). The price/flow gap is mean-reverting over windows of 4-8 weeks. After persistent flow divergence, price either re-aligns with flow direction (flow leads price) or flow re-aligns with price direction (price leads flow).
H2 (asymmetric response). Outflow-driven price moves are sharper than inflow-driven price moves of equivalent dollar magnitude, because outflows are typically forced (redemption pressure) while inflows are typically discretionary (allocation patience).
H3 (derivatives as bridge). Open interest changes in perpetual futures bridge the gap between T+0 price action and T+2 reported spot flows. OI changes are observable in near real-time and may serve as a leading indicator of subsequent reported flow data.
H4 (regime conditionality). The price/flow gap is most informative in range-bound or early-recovery regimes; less informative in strong trending phases when both engines align.
These hypotheses are testable with the existing BiffCoin backtest infrastructure. They are listed here to indicate that the framework is meant as a research starting point, not a finished conclusion.
7. Discipline: What This Paper Refuses to Claim
Five claims this paper deliberately does not make. Listing them explicitly is part of the brand commitment.
-
We do not claim XRP will outperform. The flow divergence observed in May 2026 is one week of data. It may continue, may fade, or may reverse next week.
-
We do not name a catalyst for the 25 May V-bottom. The structural pattern (synchronised dip + bounce across the complex) is consistent with several possible causes (leverage flush, liquidity sweep, macro impulse, basket flow). Without matching the candle to verifiable liquidation data, an ETF flow event, a macro release, an exchange outage, or a specific news headline, the cause is a hypothesis, not a fact.
-
We do not claim the May 25 session showed extreme correlation across all three pairs. On the verified calendar-day window (Section 3.3) BTC↔XRP and ETH↔XRP were elevated versus baseline; BTC↔ETH was modestly below its already-high baseline. The original X thread that motivated this paper reported 0.91-0.94 across all pairs based on a sliding 24-hour window; on the reproducible calendar-day window the figures are 0.80-0.86 and two of three pairs are meaningfully above baseline (one substantially: BTC↔XRP at +0.10). The original claim overstated the magnitude. We revise it here.
-
We do not claim flow divergence will reach price. Flow can drift indefinitely without being absorbed into price. Hypothesis H1 is a research direction, not a conclusion.
-
We do not claim this framework is novel. Cross-coin correlation analysis is standard quant work. Tracking ETF flows is standard portfolio analytics. The contribution here is the specific combination of intraday correlation with weekly flow in a single decision-system framework, plus the discipline of flow-context tagging rather than flow-driven signal generation.
8. Implications
If the framework holds across more cases than this single observation, three practical implications follow:
For traders. Adding a weekly flow-context lens to an existing price-based methodology provides a slow-moving narrative variable that may help with position sizing, holding period decisions, and post-trade interpretation. It is not a signal generator on its own.
For analysts. Reporting "everything moved together this week" based on price alone may obscure positioning changes that take multiple weeks to reach price. Including weekly flow context in market recaps is a small editorial change with potentially material informational gain.
For decision-system designers. Keeping execution flow-blind and interpretation flow-aware preserves backtestability without sacrificing the qualitative richness that flow context provides. This separation is generalisable beyond crypto to any market where execution-frequency data and allocation-frequency data exist on materially different timescales.
9. Limitations and Discipline
This paper relies on a single observed event. The framework is hypothesised from the case, not validated against a broad sample. Specific limitations:
9.1 The T+2 reporting lag problem
Intraday price data is T+0 (instantaneous). Institutional flow data (CoinShares, SoSoValue, CoinGlass ETF trackers) lags by 24-48 hours; weekly aggregates lag by several days. A system attempting to trade T+0 price action on T+2 flow data suffers from temporal mismatch by design.
The two-timescale view is useful for understanding market structure. It is not directly useful as a real-time trading signal, because the slower variable arrives late.
9.2 Liquidity-impact non-linearity
Capital flow does not equate to uniform price impact. A US$67M inflow into XRP-linked products shifts price by a different percentage than a US$67M inflow into BTC ETFs, depending on:
- Resting limit-order depth on either side of the book
- Execution venue distribution across the asset's vehicles
- Hedging activity by ETF authorised participants
- Spot vs perpetual-derivative market depth ratios
Equal dollar flow does not imply equal price impact. This breaks any naive "flow predicts price" extrapolation that does not account for liquidity depth.
9.3 Sample-size constraints
One week of flow data is noise. Four consecutive weekly readings in the same direction, corroborated by independent on-chain metrics, is the minimum threshold for treating divergence as a potential rotation. The framework is generated from this one case; validating it requires running the same analysis across many more observations and ideally against historical examples with known subsequent outcomes.
9.4 Regime dependence of intraday correlation
The trailing 21-day baseline correlations reported in Section 3.1 (0.75-0.89 on log-return basis) are themselves elevated relative to multi-year historical baselines. The crypto market in May 2026 is in a high-correlation regime. The framework's claims about divergence between intraday and weekly may differ in a future low-correlation regime (e.g., during a strong directional trend in one asset).
9.5 Window-size sensitivity for the baseline
The 21-day baseline used in this paper is constrained by the 500-bar common window we were able to retrieve from MEXC's public endpoint at time of writing. A 90-day or 180-day baseline would be preferable for stability and would provide a more robust reference. We commit to recomputing the baseline against a longer window in v1.1 of this paper.
9.6 Flow-data primary sourcing — resolved
In earlier drafts (v0.x–v1.1) this section flagged the flow figures as awaiting primary-source verification from CoinShares. This was resolved in v1.2: the figures in Section 3.5 are now taken verbatim from the CoinShares Digital Asset Fund Flows report, Volume 285 (week ending 18 May 2026), published by CoinShares Research. The XRP inflow figure that varied across secondary sources (US$42M-US$67.6M) is verified at +US$67.6m per CoinShares primary. The wallet-spike figure (~4,300 new XRP wallets on 22 May) remains a secondary-reported figure; if used publicly it should be confirmed from on-chain data (XRPSCAN or similar) rather than via reporting of reporting.
9.7 The discipline, stated plainly
Don't overclaim a catalyst. Name the structural pattern. Verify against multiple data sources. Wait for repetition before treating an observation as a trend.
This is the principle the BiffCoin research character operates under. This paper is an exercise in that principle.
10. Reproducibility Appendix
The numerical results in this paper are computed from publicly accessible data and reproducible code. Anyone with internet access and a Python interpreter can verify the correlation, volatility, and V-bottom figures by following the steps below.
10.1 Data
Pull 1-hour klines from MEXC's public spot API:
GET https://api.mexc.com/api/v3/klines
  ?symbol=BTCUSDT&interval=60m&limit=1000
GET https://api.mexc.com/api/v3/klines
  ?symbol=ETHUSDT&interval=60m&limit=1000
GET https://api.mexc.com/api/v3/klines
  ?symbol=XRPUSDT&interval=60m&limit=1000
For longer histories, paginate by passing endTime set to the
oldest received bar's open time minus one millisecond and
fetching again.
10.2 Correlation computation
Align bars across all three symbols by open-time. Drop any timestamps not present in all three. Compute log returns as:
r_log[t] = ln(close[t] / close[t-1])
Compute intra-bar returns as:
r_intra[t] = (close[t] - open[t]) / open[t]
Compute Pearson correlation between paired return series using
standard library statistics.correlation or numpy
np.corrcoef. The results in Section 3 are reproducible to 4
decimal places.
10.3 Volatility normalisation
Standard deviation of hourly log returns over the 21-day window
gives σ_hr. Multiply by √(24 × 365) for annualised volatility.
10.4 Code
A reference implementation of the computations in this paper lives at:
biffcoin/papers/001_compute.py
Run from project root:
python3 biffcoin/papers/001_compute.py
Requires only the Python standard library and the requests
package. Fetches data live from MEXC's public klines endpoint at
runtime. Output should match the figures in Sections 3.1, 3.2,
3.3, and 3.4 to four decimal places when run against the same
trailing-baseline window.
References
- CoinShares Research, Digital Asset Fund Flows | May 18 2026 (Volume 285, James Butterfill). Source: https://coinshares.com/insights/research-data/fund-flows-18-05-26/ Mirror: https://researchblog.coinshares.com/volume-285-digital-asset-fund-flows-weekly-report-9c2536e39a4b Primary source for all Section 3.5 figures.
- CoinShares Research, Digital Asset Fund Flows | May 11 2026 (week-ending prior to the event window). Source: https://coinshares.com/insights/research-data/fund-flows-11-05-26/
- CoinDesk, "XRP funds see fresh inflows and wallet spike as bitcoin, ether funds bleed" (22 May 2026).
- CoinDesk, "Bitcoin holds near $77,400 as derivatives signal caution" (20 May 2026).
- CoinDesk, "Bitcoin tanks to $74,300 as spot ETFs bleed $2.26 billion in two weeks" (23 May 2026).
- 24/7 Wall St., "Bitcoin ETFs pulled in $2B in April: can the flows continue in May?" (20 May 2026).
- The Economic Times, "Bitcoin consolidates near $77,000 while US credit downgrade and $648M ETF outflows weigh on sentiment" (May 2026).
- The Economic Times, "Bitcoin faces fresh selling pressure despite U.S.-Iran easing; over $400M liquidated in 1 day" (May 2026).
- BiffCoin observation log,
20260525_synchronized_v_bottom.md. - BiffCoin observation log,
20260525_xrp_flow_divergence.md. - BiffCoin strategy walk-forward results,
biffcoin/backtest/results/20260524T052835Z_walkforward.json.
Glossary
- Alpha — return in excess of a benchmark (here, buy-and-hold of the same asset over the same window).
- Authorised Participant (AP) — institutional entity that creates and redeems ETF shares with the issuer; AP hedging activity is one of the mechanisms linking ETF flows to spot market price impact.
- Backtest — historical simulation of a trading strategy against past data.
- Beta — systematic exposure to a broad asset-class factor; here, the tendency of all major crypto assets to move together in response to macro signals.
- Intra-bar return — close minus open within a single bar, divided by open, expressed as percentage.
- Log return — natural logarithm of (close / prior close); the standard textbook measure of bar-to-bar return.
- Open interest (OI) — total notional value of open positions in a derivatives contract; changes in OI reflect new leverage entering or leaving the market.
- Pearson correlation (ρ) — standard linear correlation coefficient, ranging from -1 to +1, between two variables.
- Perpetual futures (perps) — futures contracts with no expiry date; the dominant derivative product in crypto.
- TWAP / VWAP — Time-Weighted / Volume-Weighted Average Price; execution algorithms used by institutions to minimise market impact when placing large orders.
- Walk-forward validation — backtest methodology in which parameters are optimised on an in-sample window and then evaluated on a separate out-of-sample window the strategy did not see during optimisation.
Standing disclaimer
Biff is a research character — an analytical persona operated by NL. The contents of this paper are general information and methodological discussion, not financial advice. Nothing in this paper is a recommendation to buy, sell, or hold any financial instrument. Cryptocurrency trading involves substantial risk, including the total loss of capital. 18+ only. Do your own research.
Changelog
- v1.4 (2026-05-26, visual layer added) — Three diagrams embedded
inline: Figure 1 (cross-coin correlation matrix heatmap, baseline
vs event-day plus delta panel), Figure 2 (V-bottom σ-normalised
bar chart), Figure 3 (CoinShares Volume 285 weekly fund flows
horizontal bar chart). All three rendered by
biffcoin/papers/001_visuals.py, which re-uses the data layer from001_compute.pyfor correlation and V-bottom values (ETF flows are hardcoded from the primary CoinShares source). Also clarified Section 3.4 framing: the V-bottom sits at 21:00-22:00 UTC on 24 May, which is 07:00-08:00 AEST on 25 May — one hour before the formal UTC calendar-day event window but within the same Australian trading day that motivated the analysis. - v1.3 (2026-05-26, after second reviewer round) — Compute
script future-proofed via a hardcoded
FETCH_ANCHOR_UTCat 2026-06-01, replacingdatetime.now()as the look-back anchor. Script now produces identical figures regardless of when it is re-run, addressing Reviewer 1's "future-proofing vulnerability." Bessel-correction commentary added topearson()docstring addressing Reviewer 2's note. Re-running the future-proofed script produces n=24 calendar-day bars (the prior n=23 was an artefact of running mid-day when the final UTC hour hadn't closed). All event-day correlations updated to the n=24 figures (BTC↔ETH 0.86, BTC↔XRP 0.85, ETH↔XRP 0.80). The "delta vs baseline" story strengthened: two of three pairs now meaningfully elevated (was: one of three under n=23). Abstract rewritten per Reviewer 2's exact suggested phrasing for the correlation sentence. Section 2.2 added a one-sentence note onln(1+x) ≈ xper Reviewer 1's polish point. All sections updated to reference n=24 and the new correlation figures. Section 5.1 alpha "+36.6 percentage points" verified for arithmetic and phrasing precision (Reviewer 1 polish point). - v1.2 (2026-05-26, after primary-source verification) — Flow figures in Section 3.5 replaced from secondary-source ranges with verbatim figures from CoinShares Volume 285 (week ending 18 May 2026). XRP inflow figure resolved at +US$67.6m. Bitcoin outflow -US$982m for the week; Ethereum -US$249m. Total weekly outflow -US$1.07bn. AUM US$157bn. Solana +US$55.1m and seven other assets with sub-US$10m inflows added for completeness. Regional flow breakdown added. Section 9.6 "Flow-data primary sourcing" marked as resolved. CoinShares Volume 285 URL added to references. Minor phrasing fixes per external review: clarified "MEXC 1h bars" rather than "MEXC spot markets" or "perpetuals" in abstract (both endpoints serve the same kline schema for this purpose); added a one-sentence note explaining n=23 vs n=24 (the 23:00 UTC bar had not yet closed at computation time).
- v1.1 (2026-05-26, later same day) — Reproducibility script
(
biffcoin/papers/001_compute.py) committed and run. Revealed that on continuous 24/7 markets, intra-bar correlation and log-return correlation are essentially identical (close[t-1] ≈ open[t]). Removed the false "intra-bar vs log-return" distinction from Section 2.2 and 3.3. Replaced with the correct distinction: window choice (calendar-day vs sliding-window) is what created the 0.91-0.94 vs 0.78-0.85 gap. Revised Section 3.3 to use verified calendar-day correlations only; revised abstract, Section 3.6, and Section 7 (Discipline) to match. The X thread's original 0.91-0.94 claim explicitly walked back as a window-choice artefact. - v1.0 (2026-05-26) — Full draft with computed baseline. Some figures (intra-bar correlation table) turned out not to match what the reproducibility script produces — corrected in v1.1.
- v0.3 (2026-05-26) — Synthesised from two parallel v0.2 drafts. Imported T+2 reporting lag limitation, liquidity illusion caveat, and derivatives-as-bridge open question. Restored Biff voice throughout.
- v0.2 (2026-05-26) — Parallel drafts produced by collaborator AIs.
- v0.1 (2026-05-25) — Initial outline.
This is BiffCoin Research Paper 001. Future papers will build on the two-timescale framework introduced here.